March 2016 National Housing Report
March 17, 2016
-REMAX
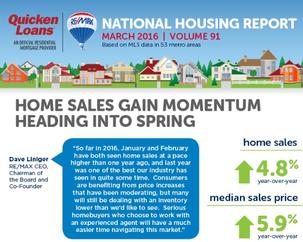
As the popular home buying season approaches, February sales saw a jump from both January and last February. The year-over-year change was 4.8% and the increase over January was 5.8%, which is in line with the 5.2% average seen in each month of February since 2009. Over the last 12 months, the average year-over-year increase in home sales has been 5.8%, and only two months, November and October, experienced sales that were not above year-ago sales. The Median Sales Price of all homes sold in February was $198,000 or 5.9% higher than the price in February 2015. Price increases have moderated over several months, with month-over-month declines seen in 6 of the last 12 months. The inventory of homes for sale remains very tight in many markets across the country, with February seeing a level that is 13.3% lower than a year ago. At the rate of home sales in February, the national Months Supply of inventory was 4.0, down from 4.7 in February 2015.
“So far in 2016, January and February have both seen home sales at a pace higher than one year ago, and last year was one of the best our industry has seen in quite some time. Consumers are benefiting from price increases that have been moderating, but many will still be dealing with an inventory lower than we’d like to see. Serious homebuyers who choose to work with an experienced agent will have a much easier time navigating this market,” said Dave Liniger, RE/MAX CEO, Chairman of the Board and Co-Founder.
“A lack of inventory continues to affect home values, as eager buyers compete for a small selection of homes. Home prices continue their long march back from the big price drops experienced in the financial crash. As more and more Americans gain equity, this increases the number of homeowners who are financially able to sell their home and buy another one. We’re seeing the benefits of this virtuous cycle in rising home prices, which are also being greatly aided by historically low mortgage rates,” added Bob Walters, Quicken Loans, Chief Economist.
Closed Transactions – Year-over-year change
In the 53 metro areas surveyed in February, the average number of home sales was 4.8% higher than one year ago, and was 5.8% higher than the previous month. February home sales are typically slightly higher than those in January and since February 2009, the average increase has been 5.2%. This February, home sales appeared to be especially strong in the northeast, in places like Boston, New York, Philadelphia and Trenton. Across the nation in February, 38 of the 53 metro areas surveyed reported higher sales on a year-over-year basis, with 16 experiencing double-digit increases, including Providence, RI +23.1%, Manchester, NH +20.5%, Augusta, ME +19.3%, Hartford, CT +18.2%, Cleveland, OH +17.1% and Wilmington, DE +16.8%.
Median Sales Price
The Median Sales Price for all homes sold in February was $198,000, down 1.0% from January. On a year-over-year basis, the Median Sales Price has now risen for 49 consecutive months, but February’s increase of 5.9% is less than the 2015 monthly average of 7.6%. Although price increases have been moderating over the last few months, low inventory supply continues to be the most significant factor pressuring prices. Among the 53 metro areas surveyed in February, 45 reported higher prices than last year, with 12 rising by double-digit percentages: Cleveland, OH +15.8%, Tampa, FL +15.6%, Boise, ID +13.4%, Miami, FL +12.2%, Orlando, FL +11.7%, and Nashville, TN +11.5%.
Days on Market – Average of 53 metro areas
The average Days on Market for all homes sold in February was 76, up 5 days from the average in January, but 4 days lower than the average in February 2015. February becomes the 35th consecutive month with a Days on Market average of 80 or less. In the three markets with the lowest inventory supply, Denver, San Francisco and Seattle, Days on Market was 38, 35 and 48 respectively. The highest Days on Market averages were seen in Augusta, ME 167, Burlington, VT 119, Des Moines, IA 114 and Chicago, IL 113. Days on Market is the number of days between when a home is first listed in an MLS and a sales contract is signed.
Months Supply of Inventory – Average of 53 metro areas
The number of homes for sale in February was 1.3% lower than in January and 13.3% lower than in February 2015. The average loss of inventory on a year-over-year basis in 2015 was 12.2%. Based on the rate of home sales in February, the Months Supply of Inventory was 4.0, which was lower than the 4.6 months supply January and the 4.7 supply in February last year. A 6.0 Months Supply indicates a market balanced equally between buyers and sellers. Burlington, VT had the highest February months supply at 11.1. Seven metros had a supply less than 2 months: Denver, CO 1.1, San Francisco, CA 1.2, Seattle, WA 1.2, Portland, OR 1.4, Dallas-Ft. Worth, TX 1.8, San Diego, CA 1.8 and Omaha, NE 1.9.
